The hidden curves of the Gartner hype cycle


The Gartner hype cycle curve. If you have worked in tech during the past 30 years, you will have seen it.
Traditionally, it is a curve with 5 stages. A steep incline that peaks and is followed by a step drop. It then bottoms out before starting a second, less steep, rise that flattens off into a horizontal line.
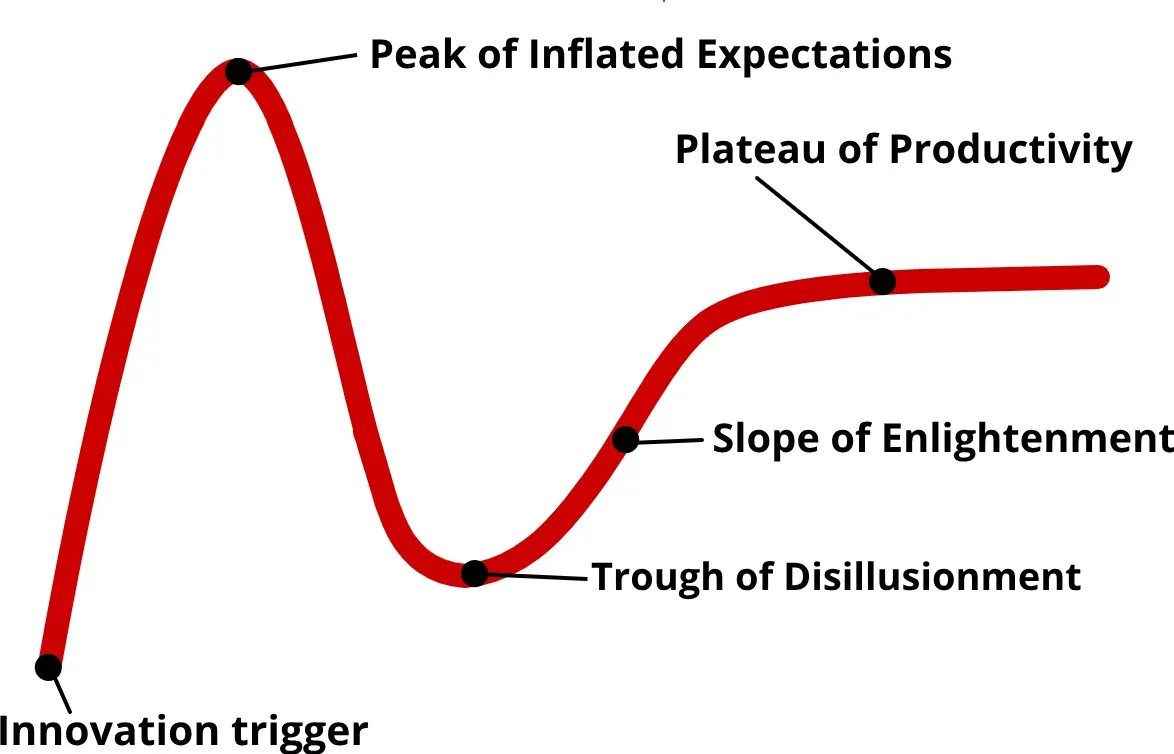
Those 5 stages, shown by the Gartner Hype Cycle curve, are:
- Innovation trigger
- Peak of inflated expectations
- Trough of disillusionment
- slope of enlightenment
- plateau of productivity
Gartner explains these 5 stages, or phases are Gartner calls them, on their website.
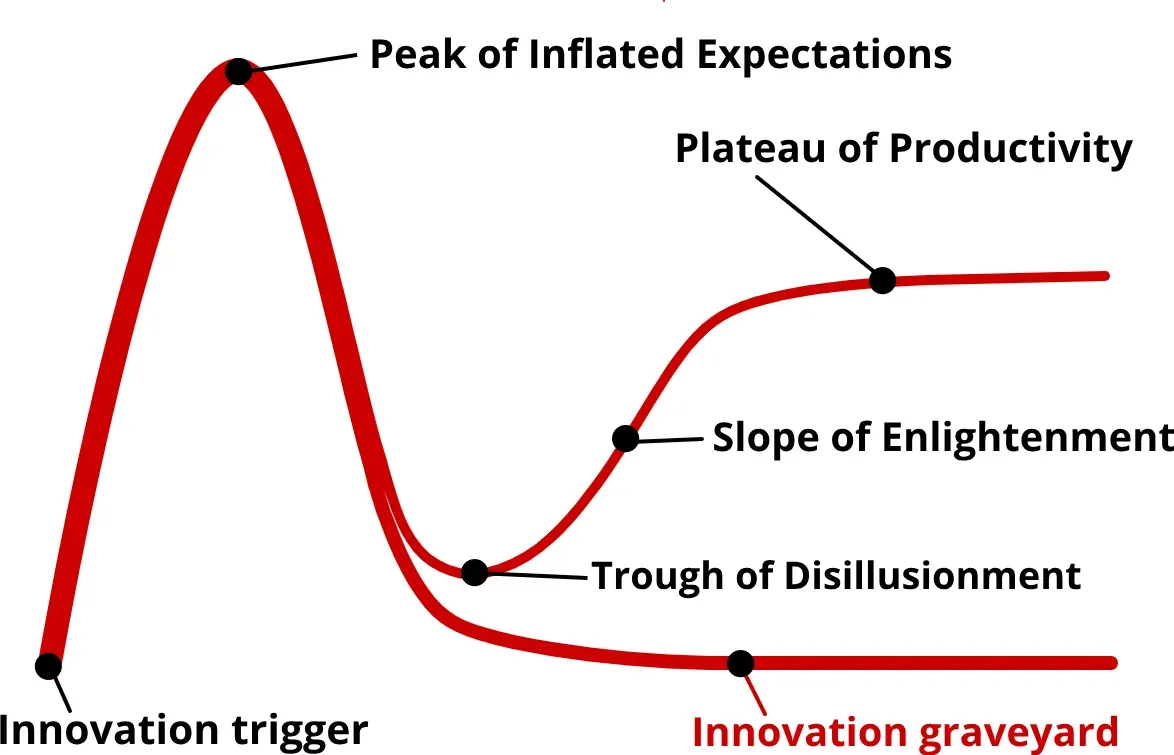
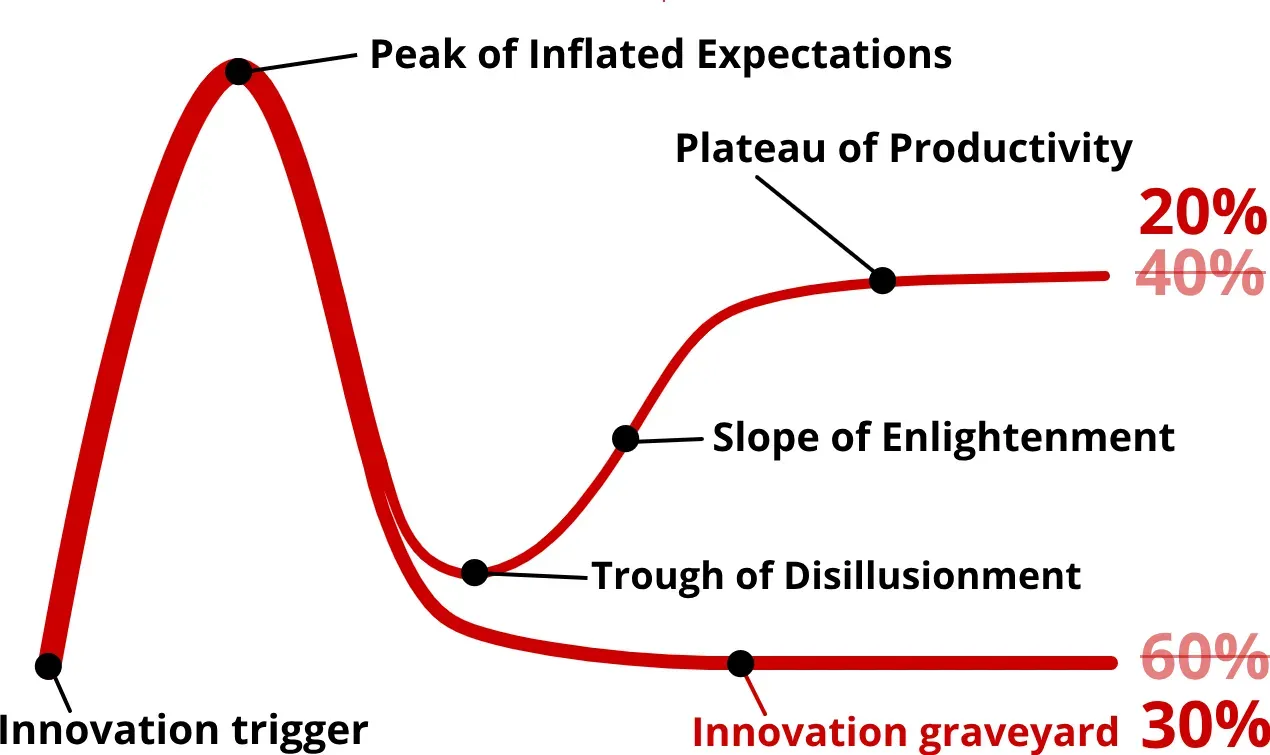
Something that the Gartner curve doesn’t show, is that the trough of disillusionment has two possible outcomes. An innovation can travel onwards up to the plateau of productivity, or it can fall down into the innovation graveyard.
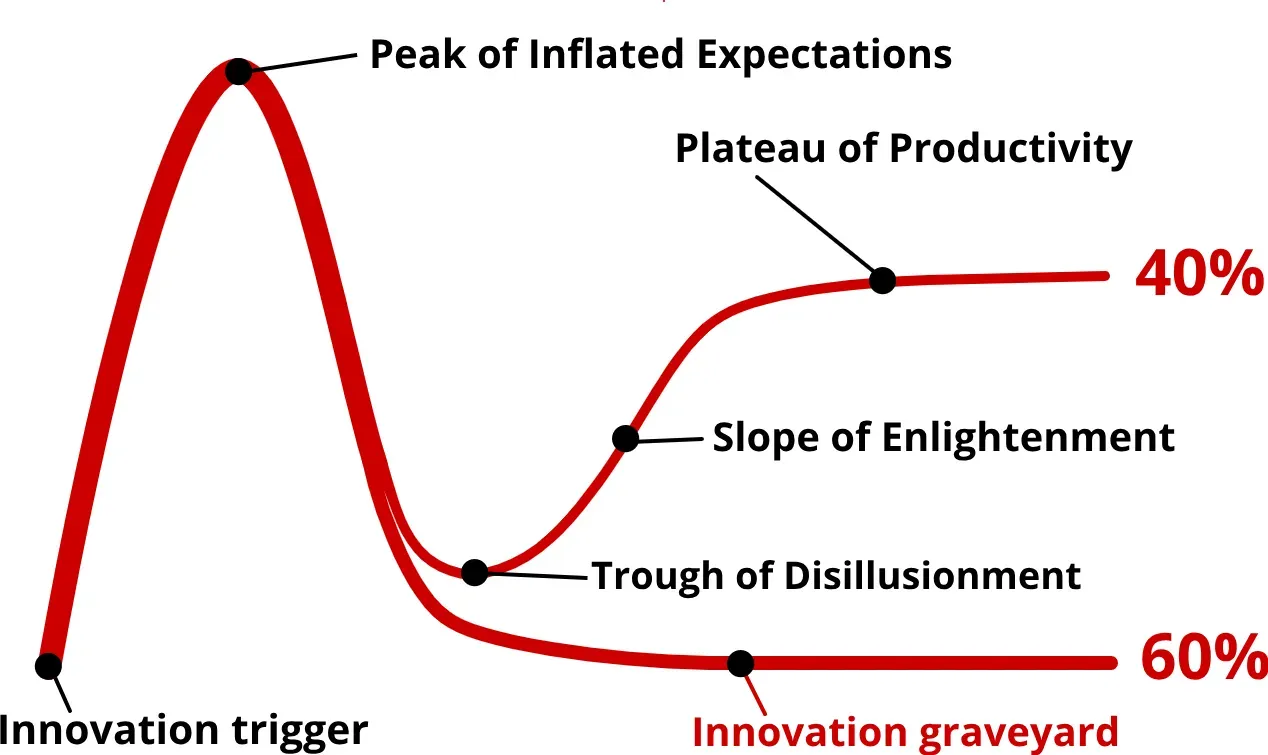
According to analysis by The Economist, of the innovations that enter the trough of disillusionment, only 40% make it to the other side and up the slope of enlightenment to the plateau and widespread adoption. The other 60% fade away and never make it out.
What is also missing from the curve is that only half of innovations enter the trough of disillusionment at all. So those following the curve all the way to the plateau are, in fact, only 20% of innovations.
The innovations that avoid the most extreme hype, just get on with things. Steadily making their way into the mainstream, avoiding the trough of disillusionment. The Economist gives cloud computing and solar panels as examples.
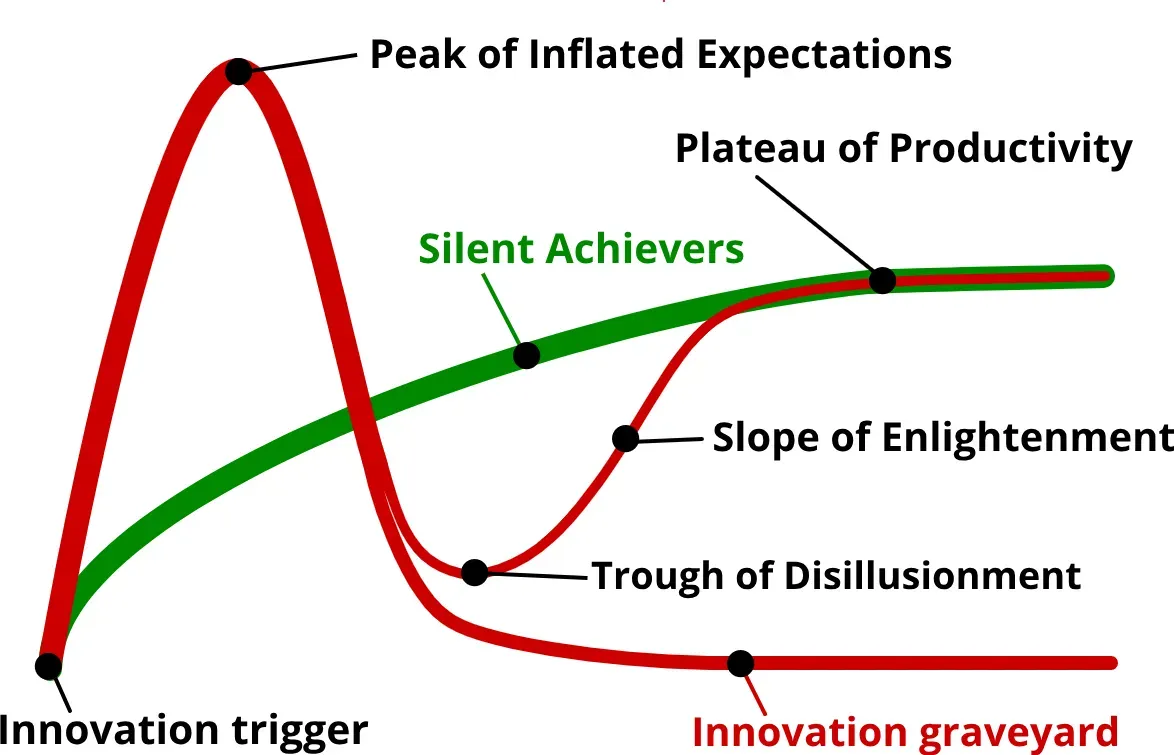
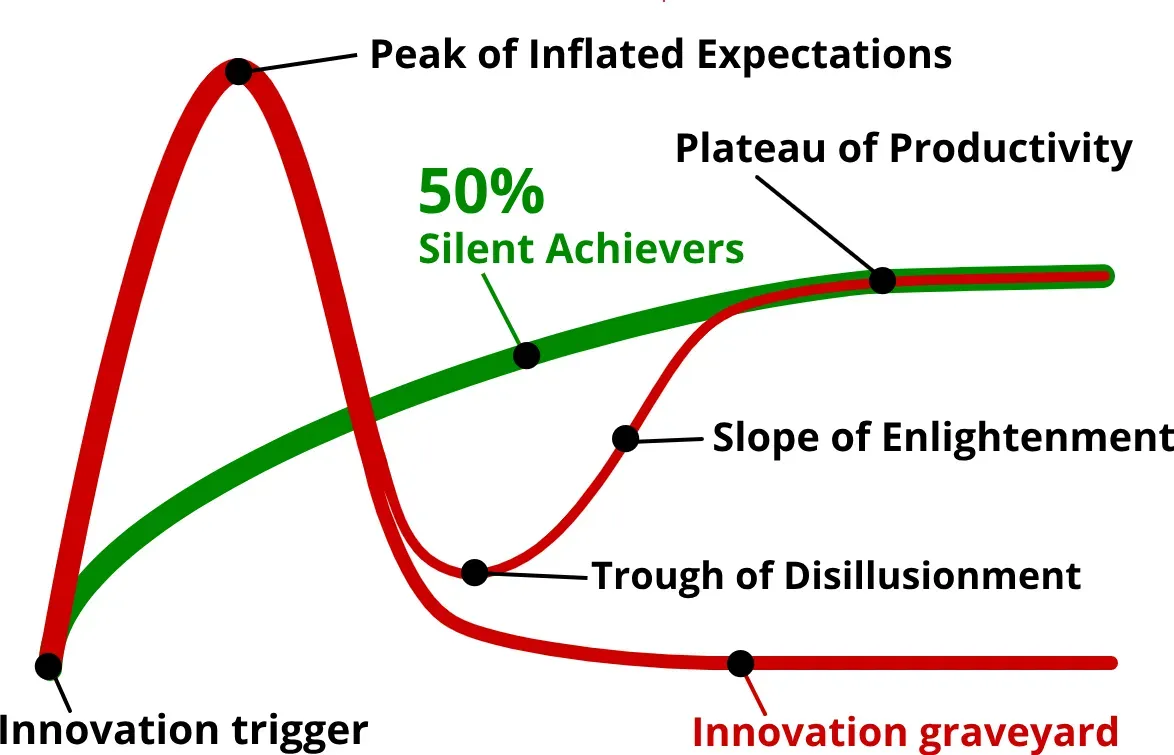
These hype-avoiding innovations are of the silent achiever type. These make up our second hidden curve. They account for as much as 50% of innovations. The traditional Gartner Hype Cycle curve only represents the path of 1 in 5 innovations.
Leaving the outcomes of 4 in 5 innovations hidden from view.
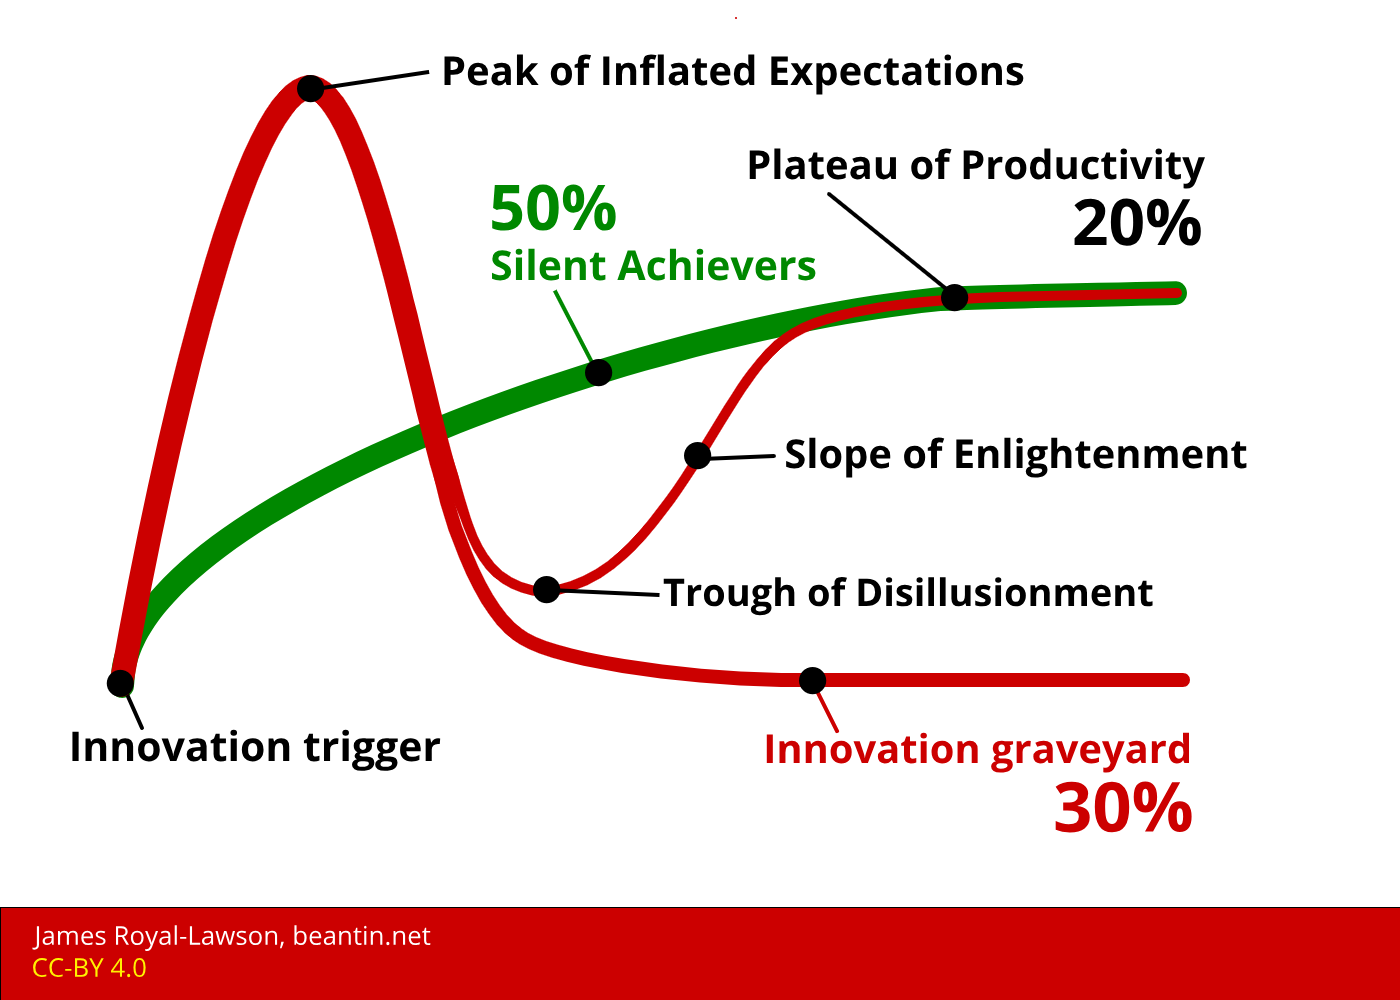
We can summarise this enhanced Gartner Hype Cycle curve, with its hidden parts revealed, by the order of magnitude of the outcomes:
- Silent achievers (50%)
- Innovation graveyard (30%)
- Plateau of productivity after the trough (20%)
So when you are looking at a Gartner curve, as a whole, you are only seeing a representation of the path that 20% of innovation triggers follow. The other 80% follow an alternative path, often one that is much less bumpy.
We find, in short, that the cycle is a rarity. Tracing breakthrough technologies over time, only a small share—maybe a fifth—move from innovation to excitement to despondency to widespread adoption. Lots of tech becomes widely used without such a rollercoaster ride. Others go from boom to bust, but do not come back. - The Economist, August 2024
The lesson? Quite simply: If something is hyped, it's hyped. It's it taking up more attention than it deserves. The trick is to keep your eye out for the silent achievers and not get too distracted by the attention grabbing hyped minority.
It's a 30-40 minute presentation that transforms this post into an extended deep dive into the hidden curves and other characteristics of the Gartner Hype Cycle.
Make a request to have James hold this presentation for your event