ROPS: Return on page speed
It’s not new news that the speed at which your webpage loads is really important, we’ve known it since the modem days of the 90s. Despite that, we’re still allowing ourselves to create large sluggish pages that are costing organisations billions each year.
“Consumers cite slow loading (64%) and difficulty in finding products (55%) as the top two irritations when shopping online” – Adventures in Retail, 2012
Research has shown that page speed is one of the top reasons people give up on a transaction. One survey said that 64% of consumers were irritated or give up due to slow page speed.
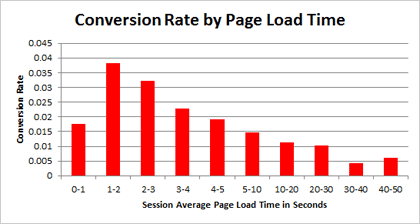
Another piece of research claims that each one second increase in page load time leads to 11% fewer page views, 16% lower customer satisfaction and, perhaps most costly, a 7% loss in conversions.

Graph borrowed from TagMan
Just as fast via mobile
In addition to this, a survey from Gomez in 2010 – which was around the time the mobile web reached tipping point – said that the majority of users expected sites to be just as fast via mobile.
“58% of mobile device users expect sites to download as quickly as they would on their home computers.” – Why Web Performance Matters, 2010
Keynote’s Mobile User Survey from 2012 said that 64% of smartphone users expect a site to load in less than 4 seconds. Slow loading web pages was a top frustration for both smartphone users and tablet users alike.
Explaining and selling
Page speed is a two-way street. Some initiatives or features will lead to an slowing down of a page. Driving in the opposite direction are optimisation efforts that lead to a increase in page speed – you’ve made things work faster!
Those two opposing directions require quite different buy-in processes.
A slowing down needs to be explained. A speeding up needs to be sold.
A couple of guys in your webteam, or a friendly consultant, would probably have no problem convincing themselves (and you!) just how much the large sliding banner on your start page was slowing things down.
Conversely, a product owner on the business side of things could be totally uninterested in technical details about how and why the sliding banner affects performance.
So, here’s a tool for you that will work in both directions. It can help you explain and sell.
Return on page speed

ROPS (%) = estimated change in conversions % – (change in load time in seconds * 6.7) %
For example, if you are going to make a change that you expect to increase conversions by 5% but that change will have an impact of 0.8 seconds on the page loading time you end up with a ROPS of -0.36.
The change gives almost no return, in fact it causes a net shrink in conversions.
Of course, not all pages are conversion pages. The majority of pages are just steps on the way. Nevertheless, every page has a goal, a call to action, or a most wanted action. “Conversions” in the formula can mean any of those things.
If your total page speed after a change is less than 2 seconds, then this formula isn’t going to hold true. People have, up to that point, a little bit of patience. The drop off begins in earnest from here and slower.
If your site is being accessed on a mobile device via mobile network then you’ve probably got a couple of extra seconds total page load time before the formula kicks in. After roughly 3-4 seconds the drop-off will be fairly similar to that of desktop and tablet visitors.
Switch it around
If we use part of the formula, we can calculate the increase in conversions needed to compensate for features that cause a page to be slower.
Conversion increase needed (%) = (change in load time in seconds * 6.7)
If we take a quick look at Swedish retailer Coop. The page has an average page load time of around 8 seconds. (When testing on my desktop computer via broadband).
Focusing on the sliding banner, the images by themselves slow the webpage down by roughly 0.6 seconds.
0.6 multiplied by 6.7 gives us 3.82%. This means that to compensate for the slowing down of the page, the sliding banner has to generate at least a 4% increase in (desktop) conversions.
The downloading and processing of the code needed to display the banner will slow the page down further, as would viewing the page via a mobile connection, increasing its “cost”.
Easy to ignore
Even though the evidence is out there – the slower your page, the poorer it will perform – it’s still far too easy for this fact to be brushed aside or overlooked.
ROPS gives you an extra argument next time you are faced with explaining or selling the impact of page speed on your bottom line.
Treasure every second.
Treasure every second – ROPS: Return On Page Speed http://t.co/AAg32dR4
— James Royal-Lawson (@beantin) December 18, 2012
